
EcoQuest's Development

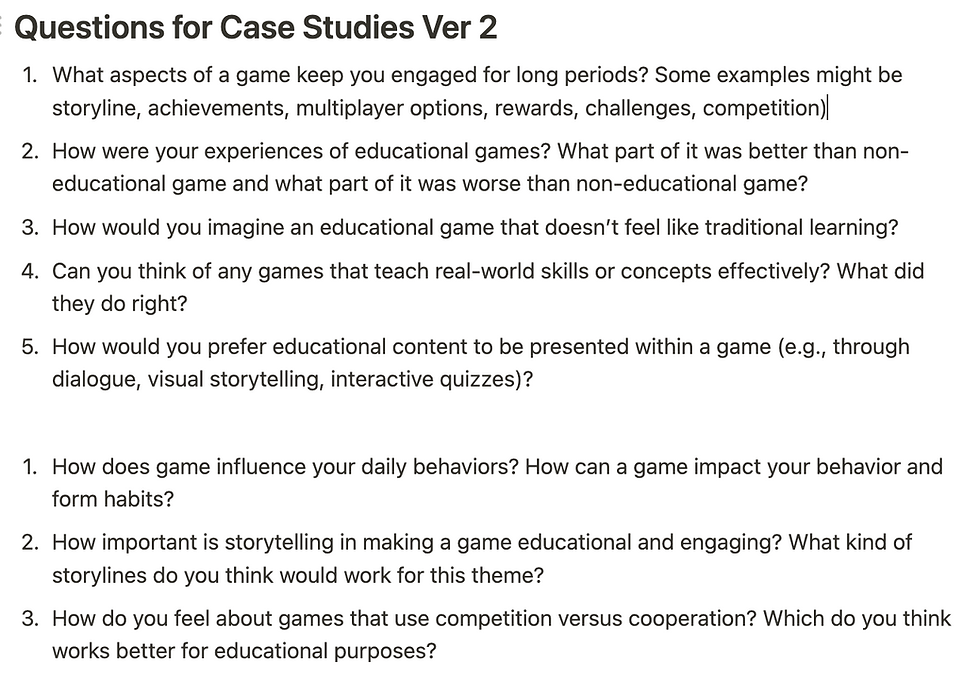
1. Survey
EcoQuest wanted to hear what students want from environmental education. We chose to hear from our peers. These testimonials sparked the development of EcoQuest's game design.
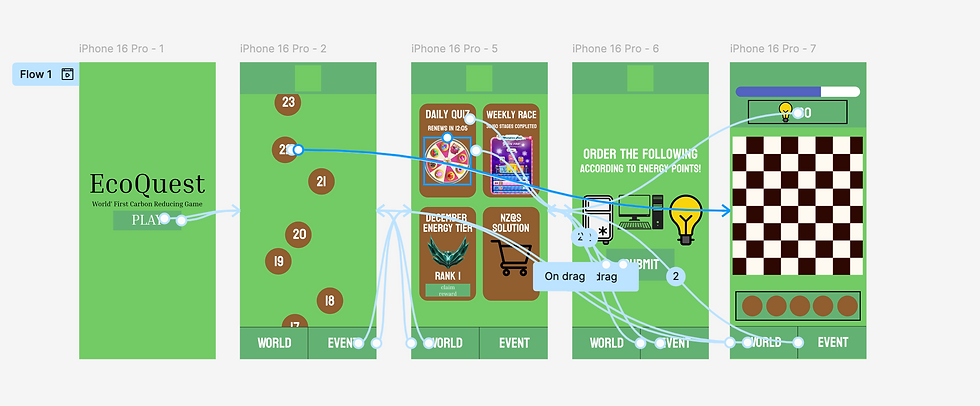
6. UI/UX & Design Outsourcing
UI/UX Design through Figma
Design Outsourcing on Mascot, Background, and Tile Icons.
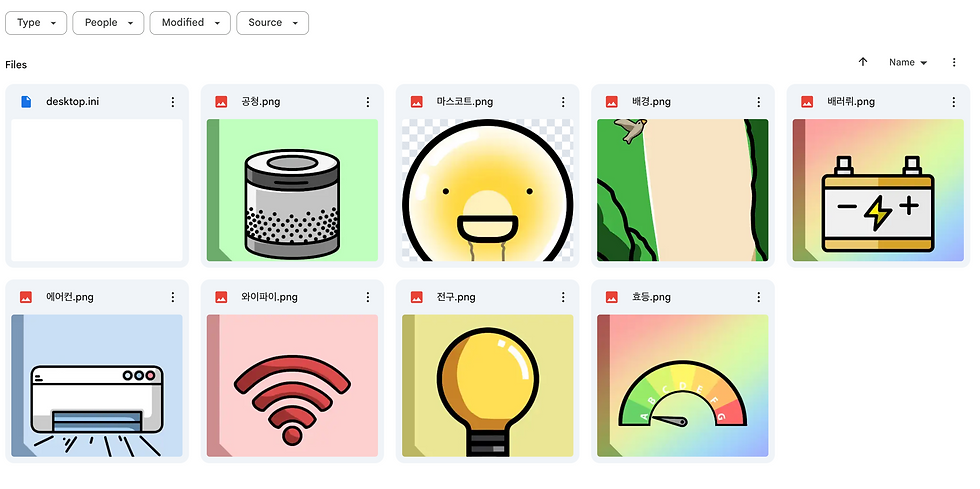
Based on the defining stage, EcoQuest first mapped out the UI/UX of the game. Upon identifying all key game graphics, we requested design outsourcing for our game background, mascot, and in-game tiles.
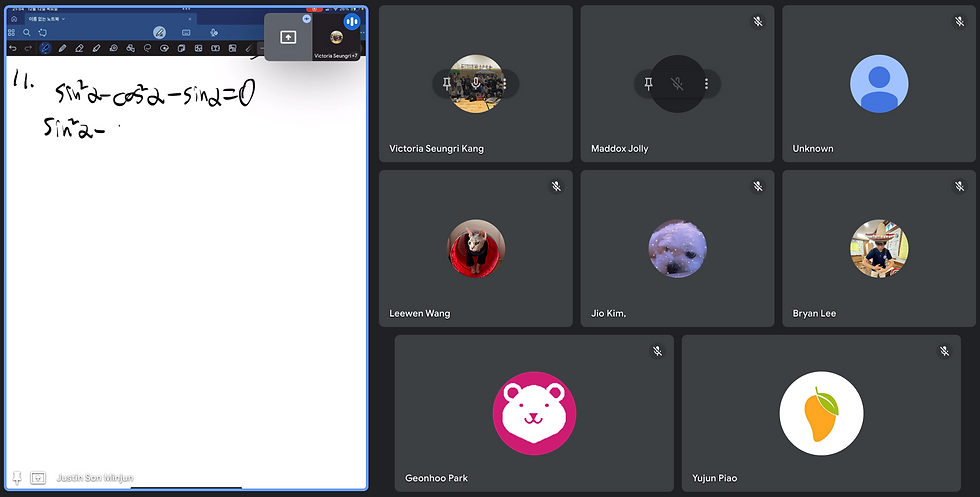
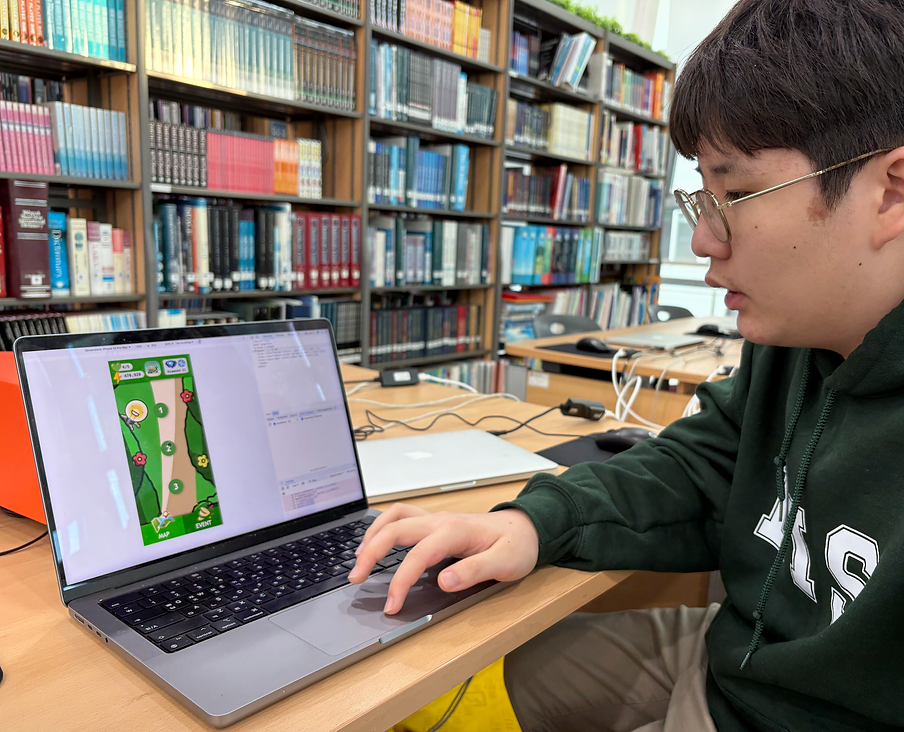
7. Game Prototype Development
Navigation Tab Sample Code
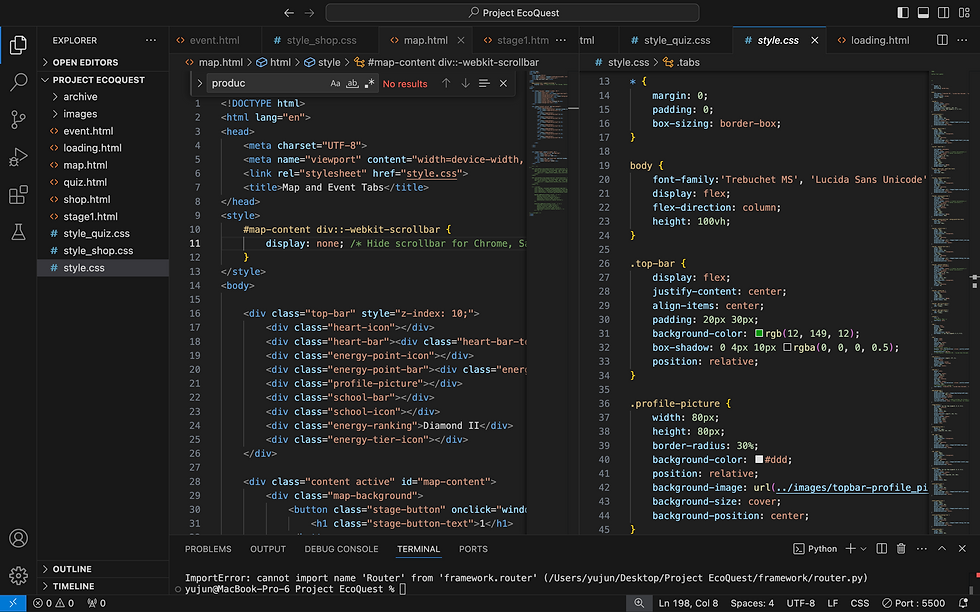
App Development Process
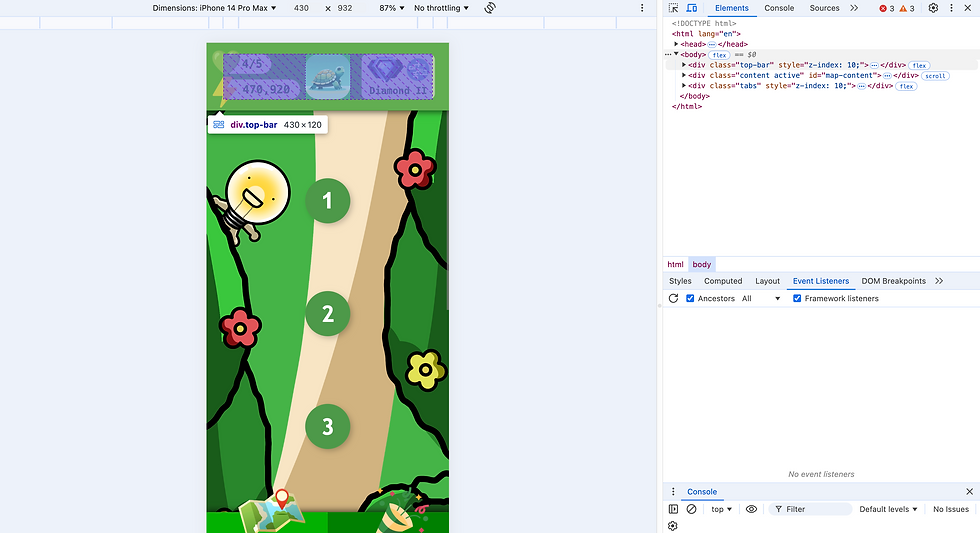
The EcoQuest team collaborated to create a playable prototype that displayed all the features brainstormed in the ideation stage.
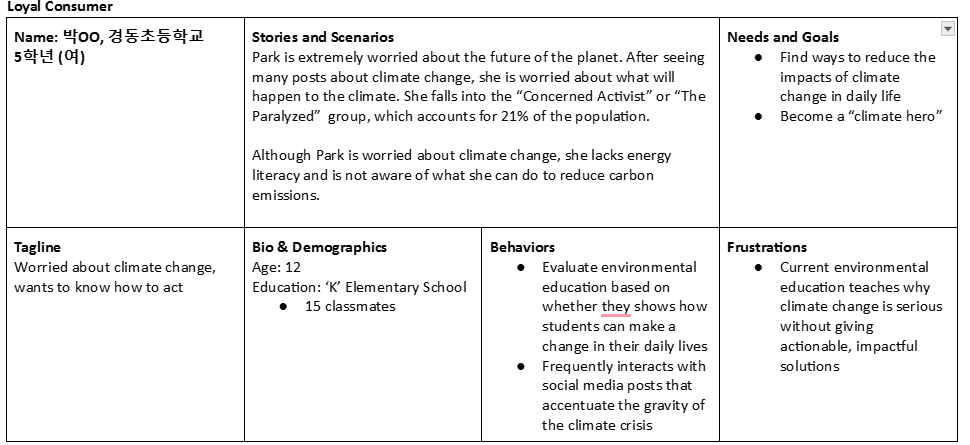
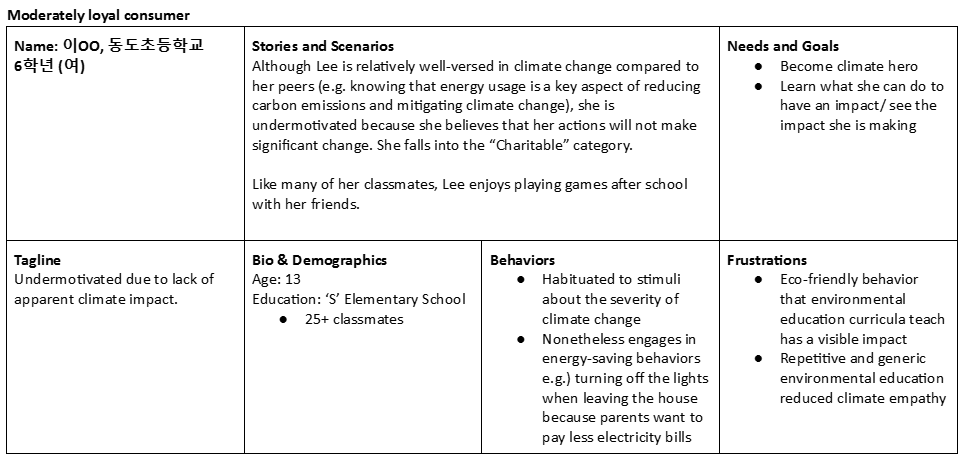
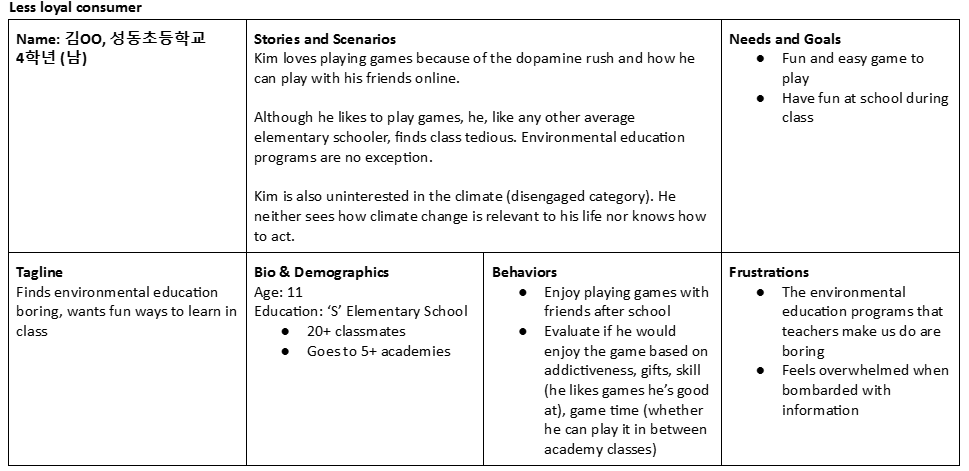
User Persona
8. Iterative User Testing
EcoQuest entered iterative user testing after initial development to receive feedback on the game from alpha-testers. As students are the end-consumers of the game, we sought out direct feedback that allowed EcoQuest to make user-oriented enhancements.
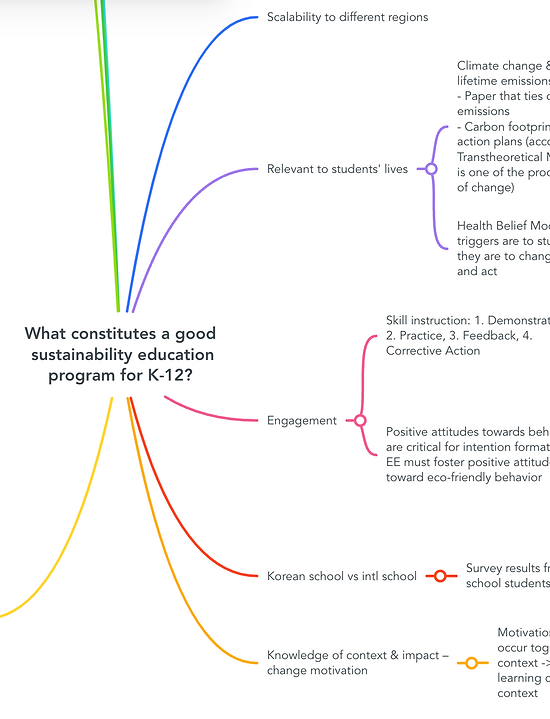

2. Research & Partnership
EcoQuest corroborated student interviews with extensive research on what constitutes an engaging and educational sustainability program. EcoQuest recognized the importance of demand management and the potential schools have to reduce emissions. From this research, we reached out to NetZero@School, a carbon emission management initiative that targets schools. Their carbon emission analysis database set the foundation for the technical feasibility of EcoQuest's key features.
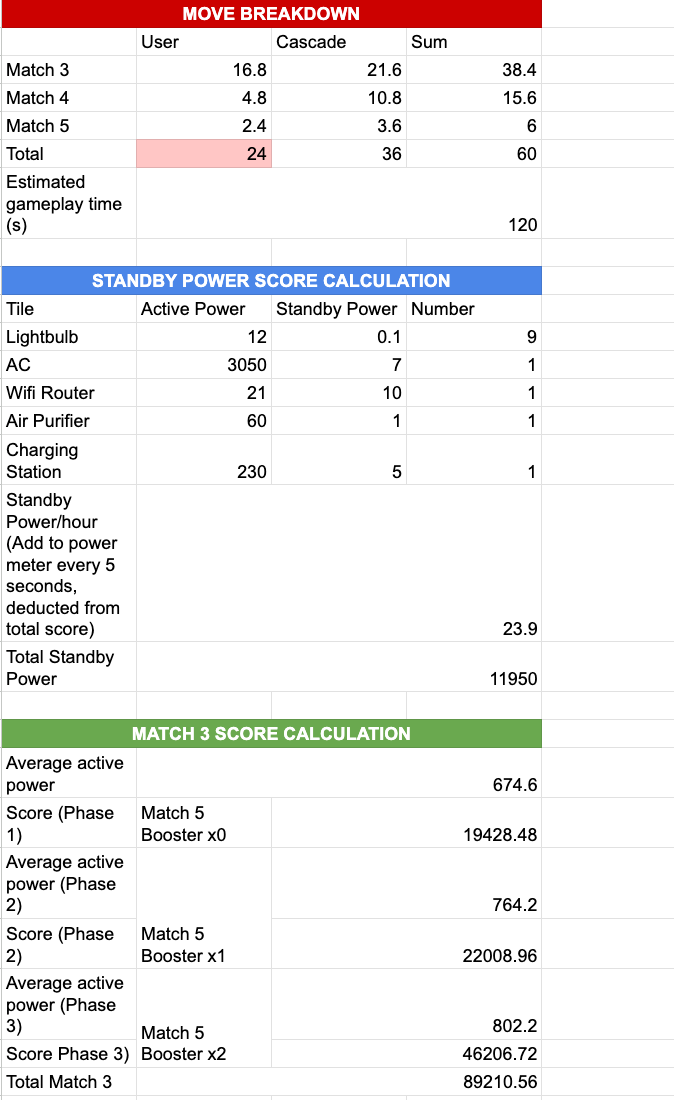
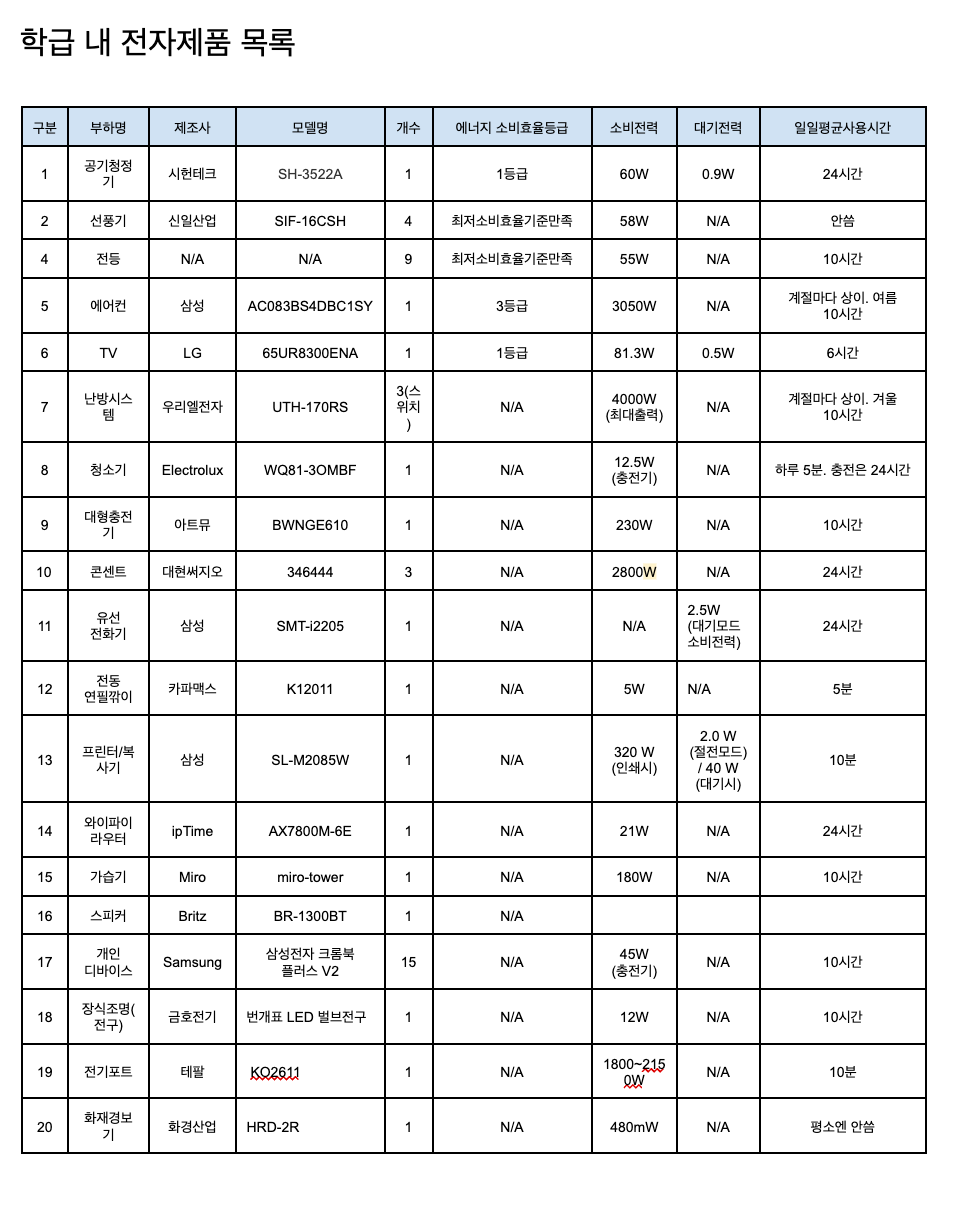
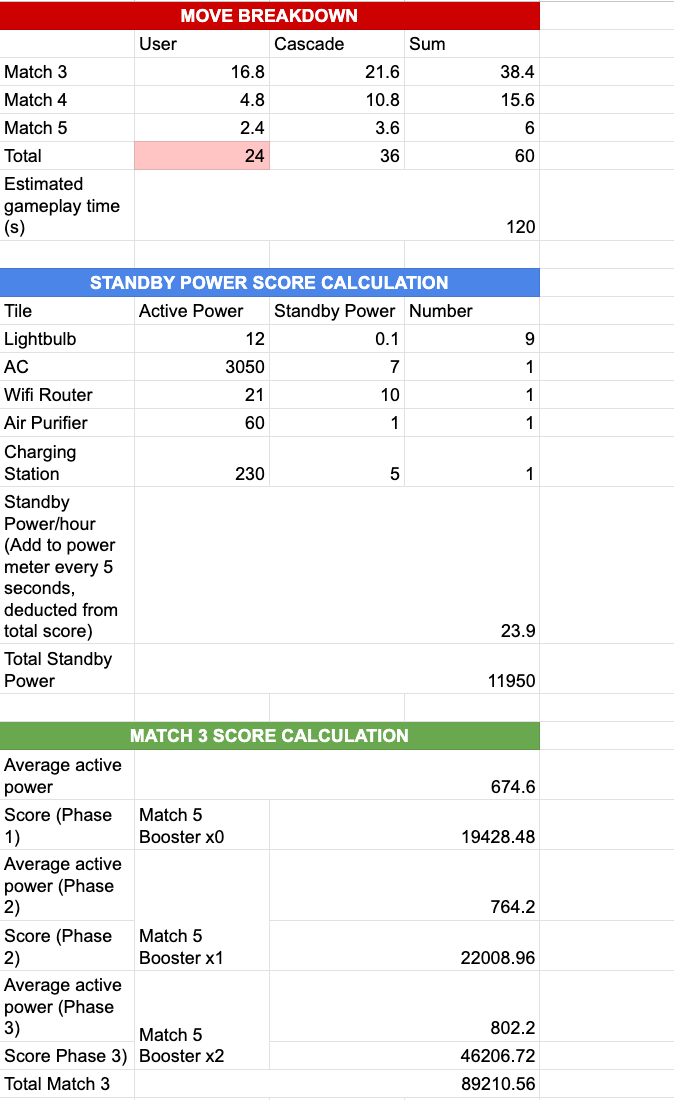
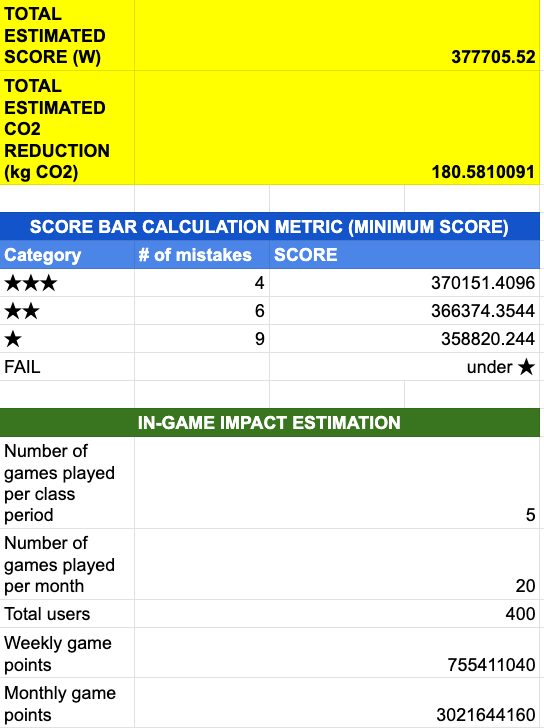
3. Analysis
EcoQuest collected data on the electricity usage of school classrooms. In particular, we recorded the type of appliance, number of appliances, energy efficiency indexes, standby power, and daily usage. Based on this proprietary database, we calculated the energy consumption and carbon emissions of a classroom and school on a weekly, monthly, and yearly basis. We used this data to simulate emission impact and design game score mechanics.
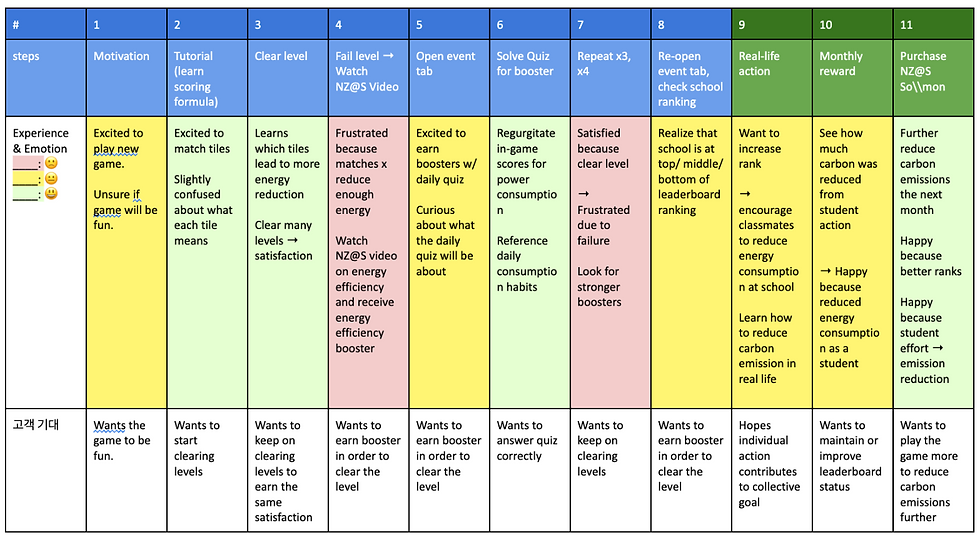
User Journey
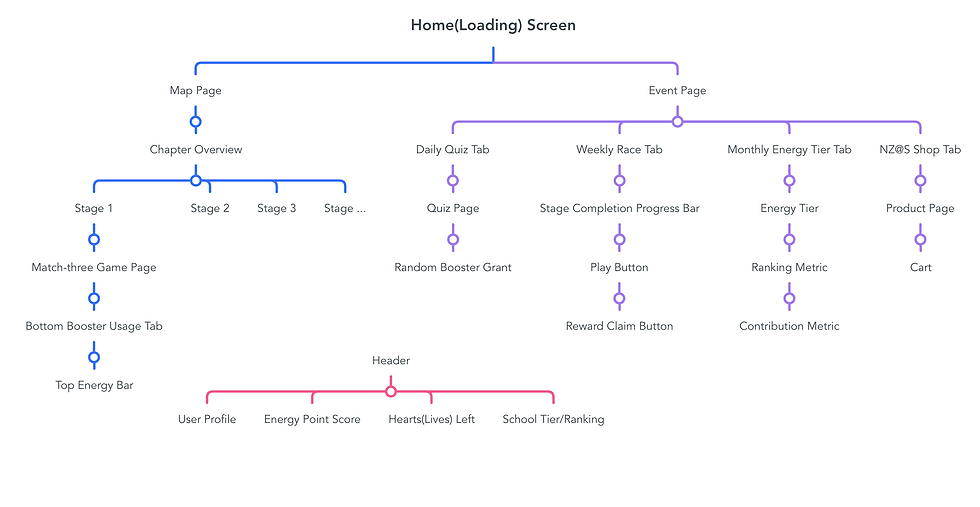
Website Map
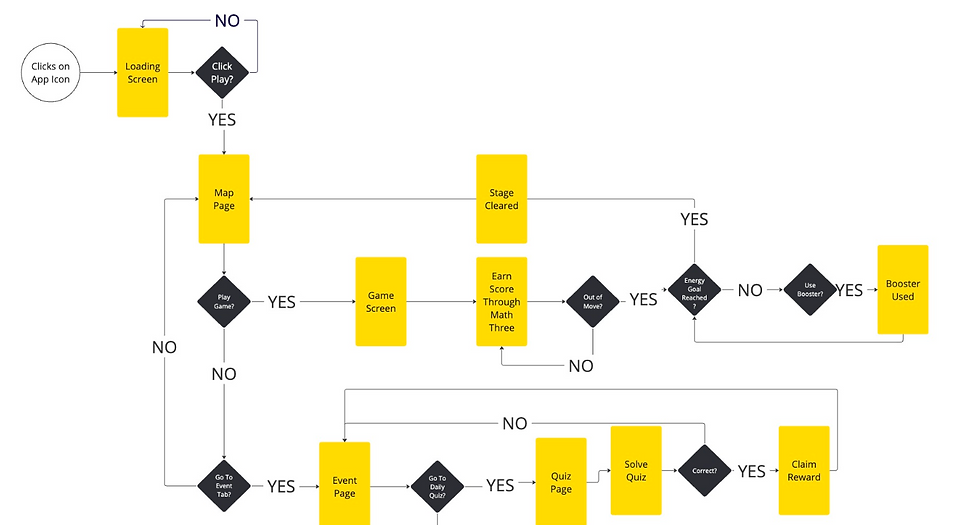
User Flow Map
4. Define
We defined our user persona and user journey to outline features and determine where users would possibly lose interest. We elaborated these ideas further in the user flow and app map diagrams.